Understanding Supply and Demand in Stock Movements
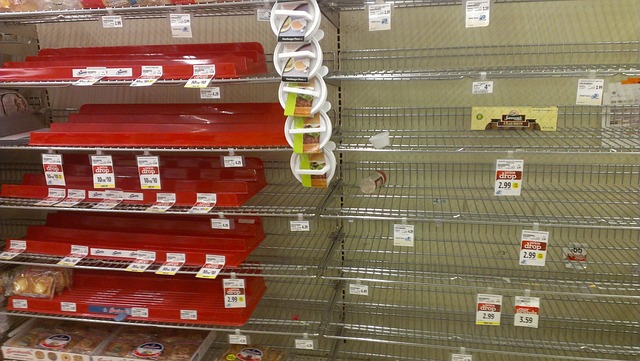
At the heart of every market move is one principle: supply and demand. It’s simple—when more people want to buy a stock than sell it, the price goes up. Flip it, and the price drops. But in the fast, reactive world of real-time markets, that balance shifts in seconds.
In live trading, demand can spike instantly, not because of company fundamentals, but because of news, global events, or even a popular influencer’s comment. Supply follows the crowd—when panic hits, sellers flood in. That tug-of-war is what makes price action such a critical focus.
To cut through the noise, traders often separate price action from volume-driven signals. Price action tells you what’s happening on the surface—where the stock is moving. Volume reveals the strength behind it. A price jump with weak volume? Might be a fake-out. A steady climb backed by growing volume? That’s real momentum.
Understanding both sides gives vloggers covering finance—and their viewers—a serious edge. It’s not about predicting the future. It’s about reading the present clearly and fast.
Volume doesn’t lie. In technical analysis, price movements get all the attention, but without volume, you’re only seeing half the picture. Volume confirms price because it shows who’s truly behind the action—real buyers and sellers putting money on the line. A breakout on low volume? Weak. But when volume swells alongside a price move, that’s conviction.
Look beneath the candles and focus on what the volume is telling you about sentiment. Is buying pressure picking up speed? Are sellers dumping into every rally? Spikes in volume can signal rising aggression, but the direction matters. If volume surges on a red candle—watch out. That’s sellers in control. If it jumps on a green one and follows through, bulls may be taking the driver’s seat.
This ties into spotting accumulation and distribution. Accumulation often shows up as steady volume on down days and sudden demand in quiet dips—that’s the quiet work of bigger players snapping up stock. Distribution works the other way: a choppy grind higher with volume ticking up suggests heavy hands unloading into strength.
And don’t assume every volume spike is a signal to act. Sometimes volume pops from one-off news, false breakouts, or retail stampedes. Read the context. Track how price reacts after the spike. Real strength tends to consolidate, not collapse.
Volume is the market’s breath. It doesn’t guarantee direction, but it tells you whether a move is being carried by whispers—or a crowd.
Spotting Institutional Footprints: How Large Traders Leave Clues
Understanding the Signs of Smart Money
In the world of trading, institutional activity often leaves behind subtle clues—if you know where to look. Large traders rarely make sudden, splashy moves. Instead, their influence is often felt through predictable patterns in price and volume.
Key Clues from Large Traders
To identify the presence of professional or institutional traders, focus on:
- Consistent volume buildups at specific price levels
- Price consolidation before major moves
- Rejections from key levels on unusually high volume
These signals don’t just happen at random; they are typically tied to accumulation or distribution phases, both of which suggest positioning by more experienced market participants.
Volume at Price vs. Random Spikes
Not all volume is meaningful. Distinguish between:
- Volume at important price levels: Indicates potential accumulation (buying) or distribution (selling) by larger players.
- Random spikes or news-driven bursts: Often unpredictable and short-lived, these are less reliable for trade setups.
By focusing on volume that aligns with support/resistance zones or long-term technical structures, you can better assess whether smart money is at play.
How to Identify Institutional Setups
Recognizing patterns that may be driven by institutions requires more than just watching candles. Look for:
- Tight consolidations with above-average volume
- False breakouts followed by strong reversals
- Repeated testing of a key level without breaking
These setups typically suggest controlled buying or selling—actions that align with institutional trading behavior. Paying close attention to footprint charts, order flow tools, and VWAP (volume-weighted average price) zones can provide further confirmation.
The goal isn’t to follow these big players blindly, but to use their presence as a sign of structure and potential opportunity in the market.
Strong trend reversals don’t happen out of nowhere—they show their hand through shifts in supply and demand. Price moves when buyers or sellers take control. A real trend-reversal zone is where that control visibly flips. Volume picks up. Candles stretch. Prior resistance turns support—or vice versa. Smart vloggers (and traders) know to watch what the crowd is doing, not just what a chart pattern suggests.
False breakouts are where most get trapped. The market fakes direction, lures in traders (or viewers, in creator terms), then reverses hard. Failed patterns teach more than successful ones if you’re paying attention: they show you where conviction actually sits. Was that breakout on low volume? Did the move clear a key level—or stop just short and stall? These are the tells.
Context is king. A reversal isn’t magic—it’s momentum meeting friction, often near a recent high, low, or broken trendline. Textbook setups are just starting points. Real signals live in nuances: how price reacts, how the volume spreads, where the crowd’s leaning and hesitating. Forget perfect patterns—follow behavior.
Volume-based indicators are the unsung heroes of chart analysis. Tools like On-Balance Volume (OBV), Accumulation/Distribution Line (A/D), and Volume-Weighted Average Price (VWAP) don’t scream for attention—but they tell you what smart money might be doing when price action alone won’t.
Start with OBV. It’s not fancy. It tracks volume in relation to price changes—if price closes higher, volume is added; if it closes lower, volume is subtracted. Over time, divergence between OBV and price can reveal muted accumulation or stealthy exits before the price moves.
The A/D Line operates on similar logic but factors in a stock’s closing price within its daily range, which can paint a more granular picture of who’s in control—buyers or sellers.
Then there’s VWAP. In one line, it anchors price action. It helps identify who’s winning the tug-of-war: institutions want to buy below the VWAP and sell above it. Day traders treat it like home base.
Now here’s the thing: don’t throw them all on your screen like a Christmas tree. Use one or two. Pair these indicators with clean supply and demand zones. If price hits a resistance area and OBV starts dropping, that’s your flashing signal. If VWAP acts like a ceiling and price can’t retake it, back off.
The goal isn’t to impress with busy charts—it’s to add conviction. Combine these indicators with structure, trend, and basic price action. You’ll make fewer trades, but better ones.
(Related Insight: What Technical Indicators Reveal About Market Sentiment)
Let’s break down two real stock charts to show how supply and demand show their hands.
First up: NVDA (NVIDIA). In late 2023, it surged into previous highs near $505. This wasn’t the first time that zone had acted as resistance. On the chart, you can see volume spikes as price tagged that level—classic supply stepping in. Sellers took profit, and price rejected hard across several sessions. But here’s the key: it didn’t collapse. Instead, it formed a tight range just below that level—low volatility, shrinking volume. That’s not exhaustion—it’s consolidation. And that’s where demand quietly loads up. The breakout came fast, with expanding range and volume. When demand is strong, the move needs little warm-up.
Second chart: AAPL. After hitting resistance around $195, it pulled back gently and flagged sideways for about two weeks. No big selloffs, just compression. During that time, daily candles showed long wicks on the downside and closes near the top—buyers absorbing dips. That’s structural demand. When it finally reclaimed $195, the follow-through was clean.
Lesson here? Supply shows up in reaction—sharp wicks at highs, heavy selling on approach. Demand, on the other hand, lurks in the quiet pullbacks and the steady base-building. Watch the zones, watch the pace, watch who flinches first.
Stop Chasing. Start Understanding the Flow.
Too many creators are sprinting in circles—chasing trends, copying formats, burning out. The smarter ones are slowing down just enough to see the patterns. Platforms shift, tools evolve, but the flow of supply and demand never vanishes. There’s always an audience. There’s always a space to fill. The job is to read it right.
Think less about going viral and more about reading the room. What’s your audience leaning into? Where’s the conversation heading? Get good at watching, not just reacting. The creators who win in 2024 won’t be the ones making noise. They’ll be the ones listening, testing, adjusting. An edge isn’t about doing more—it’s about doing just enough, but smarter. Keep it sharp. Keep it clean. And stay in the flow.


